Whether you’re resource-conscious, investigating a system slowdown, or, like me, just plain nosey, Ubuntu makes it easy to keep an eye on CPU, RAM and other hardware information.
Below are five different ways to monitor system resource usage in Ubuntu – from panel-based indicator-applets to applications installed by default.
Indicator-SysMonitor
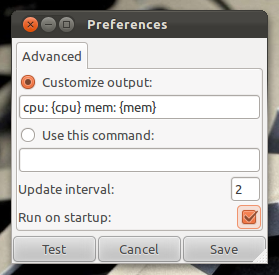
Indicator-SysMonitor does a little, but does it well. Once installed and run, it displays CPU and RAM usage on your top panel. Simple.
The applet sports a minimal amount of customisation options such as the order in which items appear on the panel and their refresh rate.
Conky Set up
Conky may be a headache to set up but it offers an almost endless variety of ways to display and view system resource usage (among plenty of other things).
We’ve shown off many slick set-ups in the past – take a look at our ‘conky‘ tag to browse through them.
One of my personal favourites is Reloj Conky as it’s small, doesn’t take up too much space and shows me the info i’m looking for without any added bling:
Screenlet
Screenlets – small desktop-based widgets for Linux – are pretty old hat today’s standards, but there are still a number of good looking and useful widgets readily available that you may want to try out.
For example, you’ll find a bunch of differently styled CPU and RAM monitors included in the screenlets-all package available in the Ubuntu Software Center.
‘Top’
The above suggestions all assume that you want to see what’s eating your resources all the time. Chances are you just want to check in now and again when things feel a bit slow or when things go wrong.
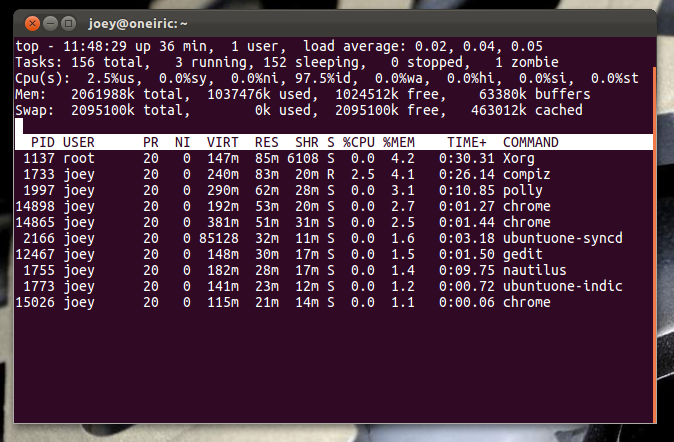
The terminal is capable of showing you running processes via the ‘Top‘ command.
All you need to do is open a terminal, whether on your desktop or, if things have frozen by pressing CTRL+ALT+F1 through F12, and entering the ‘top’ command.
You choose how many processes are displayed by pressing ‘n‘ (lowercase) and entering a number. 0 is the default; this fits as many processes as it can onto the screen – so the bigger the terminal the more processes you’ll see.
You can order the results, too: –
- P orders by CPU usage (default)
- T sorts by time
- A sorts by age (newest first)
- M orders items by RAM usage
‘System Monitor’
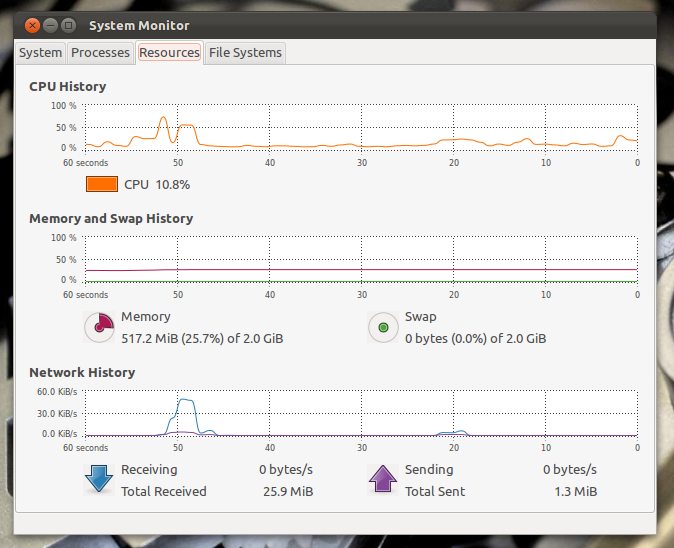
Lastly, if nothing above tickles your fancy, you can always resort to the default System Monitor application.
It’s not as flashy, but it does displays a variety of easy-to-gauge overviews. From listing active processes to a breakdown of resource usage, System Monitor has a lot that makes it the go-to tool for occasional resource-peeking.
And, unlike the rest of the options in this list, it’s the only one that offers up a direct way to kill/manage processes.


